If you want to add border styling to your tables while creating a report, you can follow the steps outlined in this tutorial.
Watch video tutorial on YouTube
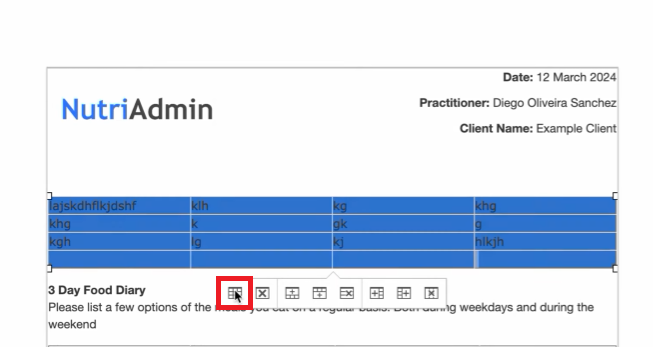
Step 1: Select the table where you want to add the borders then click on the Table properties icon.
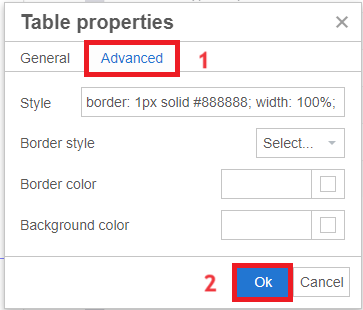
Step 2: Select Advanced then make select the style and color you need.
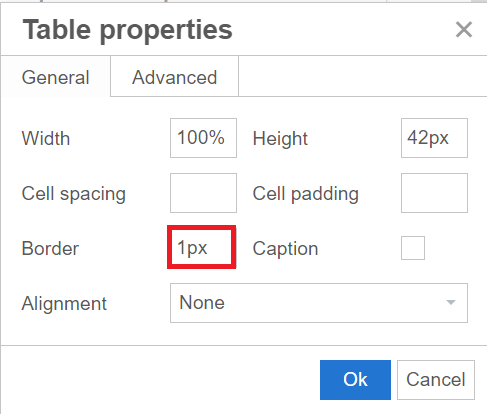
You will notice that the borders are not applied to all parts of the table. To fix this:
Step 3: Select the table again then click the table properties icon. Type in 1px in the Border part.
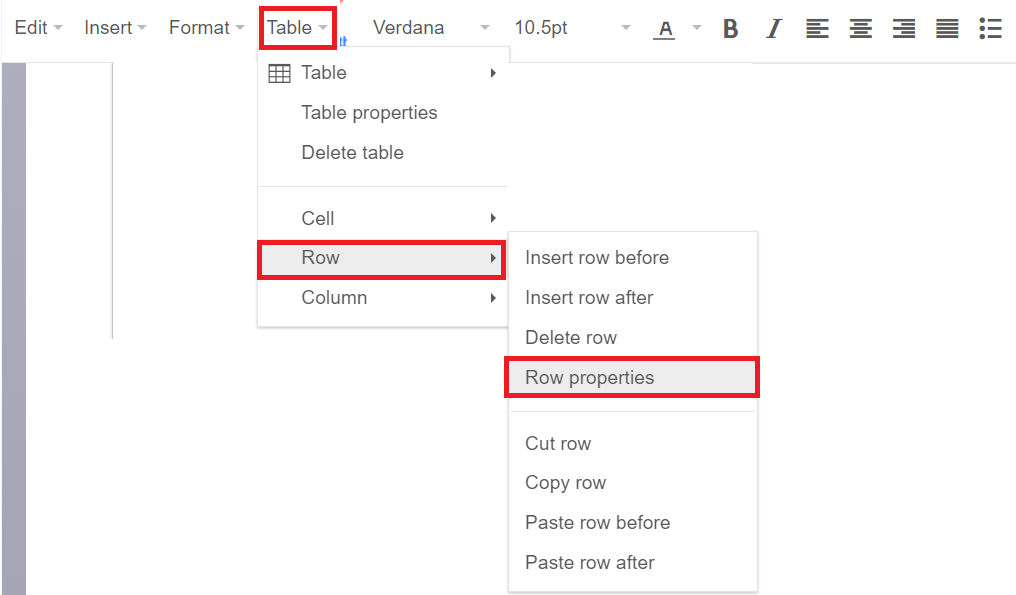
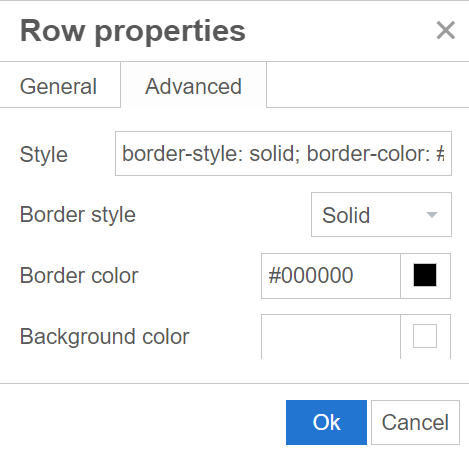
Step 4: Select the table again then on the top left of the screen, click on the Table dropdown. Select Row then Row properties.
Step 5: Select the border style and color you want based on Step 2.
Step 6: Repeat Step 4 and 5 but instead of Row, choose Column.